Here's a better way to tell how many need a job

Many economists would agree that the official U.S. unemployment rate is an inadequate measure of actual labor market conditions.
Although this is one of the most cited pieces of data on the economy as a whole, not many people understand how this indicator is calculated and who is and – more importantly – who isn’t included in it.
As a labor economist, I believe it’s important for more Americans to take a closer look under the hood to get a more accurate view of U.S. unemployment.
What’s the unemployment rate?
Unemployment is usually described in newspaper or television reports as a percentage or a rate. The U.S. unemployment rate fell from 6.7% in December to 6.3% in January, according to the latest jobs report released Feb. 5.
At a glance, the changes between the percentages may seem relatively small – what’s a few points here or there? But remember that the U.S. economy has over 160 million adults who either have jobs or are looking for them – what economists call the labor force.
A rise or fall of just 0.1 percentage point in the rate translates roughly to 160,000 people, which is equivalent to the population of a medium-sized U.S. city. And of course large changes in the unemployment rate – as we saw in early 2020 as a result of the pandemic lockdowns – represent many millions of people losing or gaining jobs.
So, although these unemployment stats seem encouraging, and the Federal Reserve is expecting the rate to keep dropping in 2021, they hide several important problems.
Under the hood
The unemployment rate that newspapers commonly cite is known as U-3. One of its biggest shortcomings is that it doesn’t include people who have given up looking for work.
To be classified as unemployed by the Bureau of Labor Statistics, a person must be without a job, currently available to work and actively looking for work in the previous four weeks.
We can see how many people have stopped looking for work by looking at the participation rate, which shows us that, in December 2020, 4 million fewer people were in the labor force than in January 2020. That gives us a participation rate of 61.5% – the lowest it’s been since 1975, excluding the worst months during the pandemic.
Another issue with how the bureau calculates the unemployment rate is that the definition of “employed” is too broad: It includes people who worked for no pay, part-time workers and the underemployed, such as those performing a job they are overqualified for.
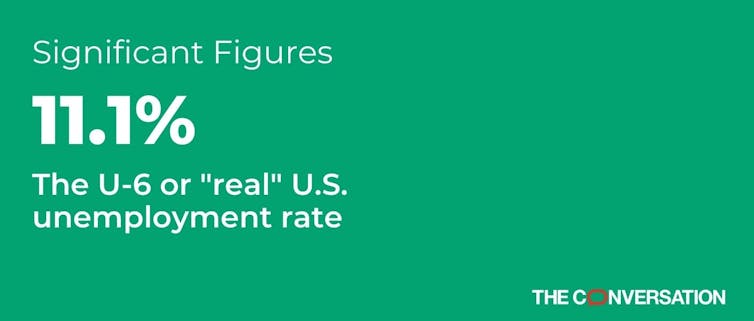
Fortunately, there is a published version of the unemployment rate intended to incorporate these people. The most important one, called U-6 or the “real” unemployment rate by the media, shows joblessness was 11.1% in January – that represents a difference of over 7 million jobs.
But there’s still a problem with this version of the unemployment rate. It implies people who are working part time are simply unemployed, for example.
A 2019 paper aimed to remedy this by classifying those people as “62.7% employed.” The resulting unemployment rate, which also corrects for other errors, is not updated, but would put it at 24.4% just after the peak of the COVID-19 crisis in May – compared with 13.3% according to U-3 and 21.2% for U-6.
Correctly estimating how many people are without work is hard. Besides these issues, rates that appear in headlines obscure significant variations such as race, education level and gender.
Finding a way to accurately reflect what’s really going on in the economy is pivotal to making good policy and fueling a recovery that lifts all boats.
[Deep knowledge, daily. Sign up for The Conversation’s newsletter.]![]()
Veronika Dolar, Assistant Professor of Economics, SUNY Old Westbury
This article is republished from The Conversation under a Creative Commons license. Read the original article.